Visualisation & Dashboarding
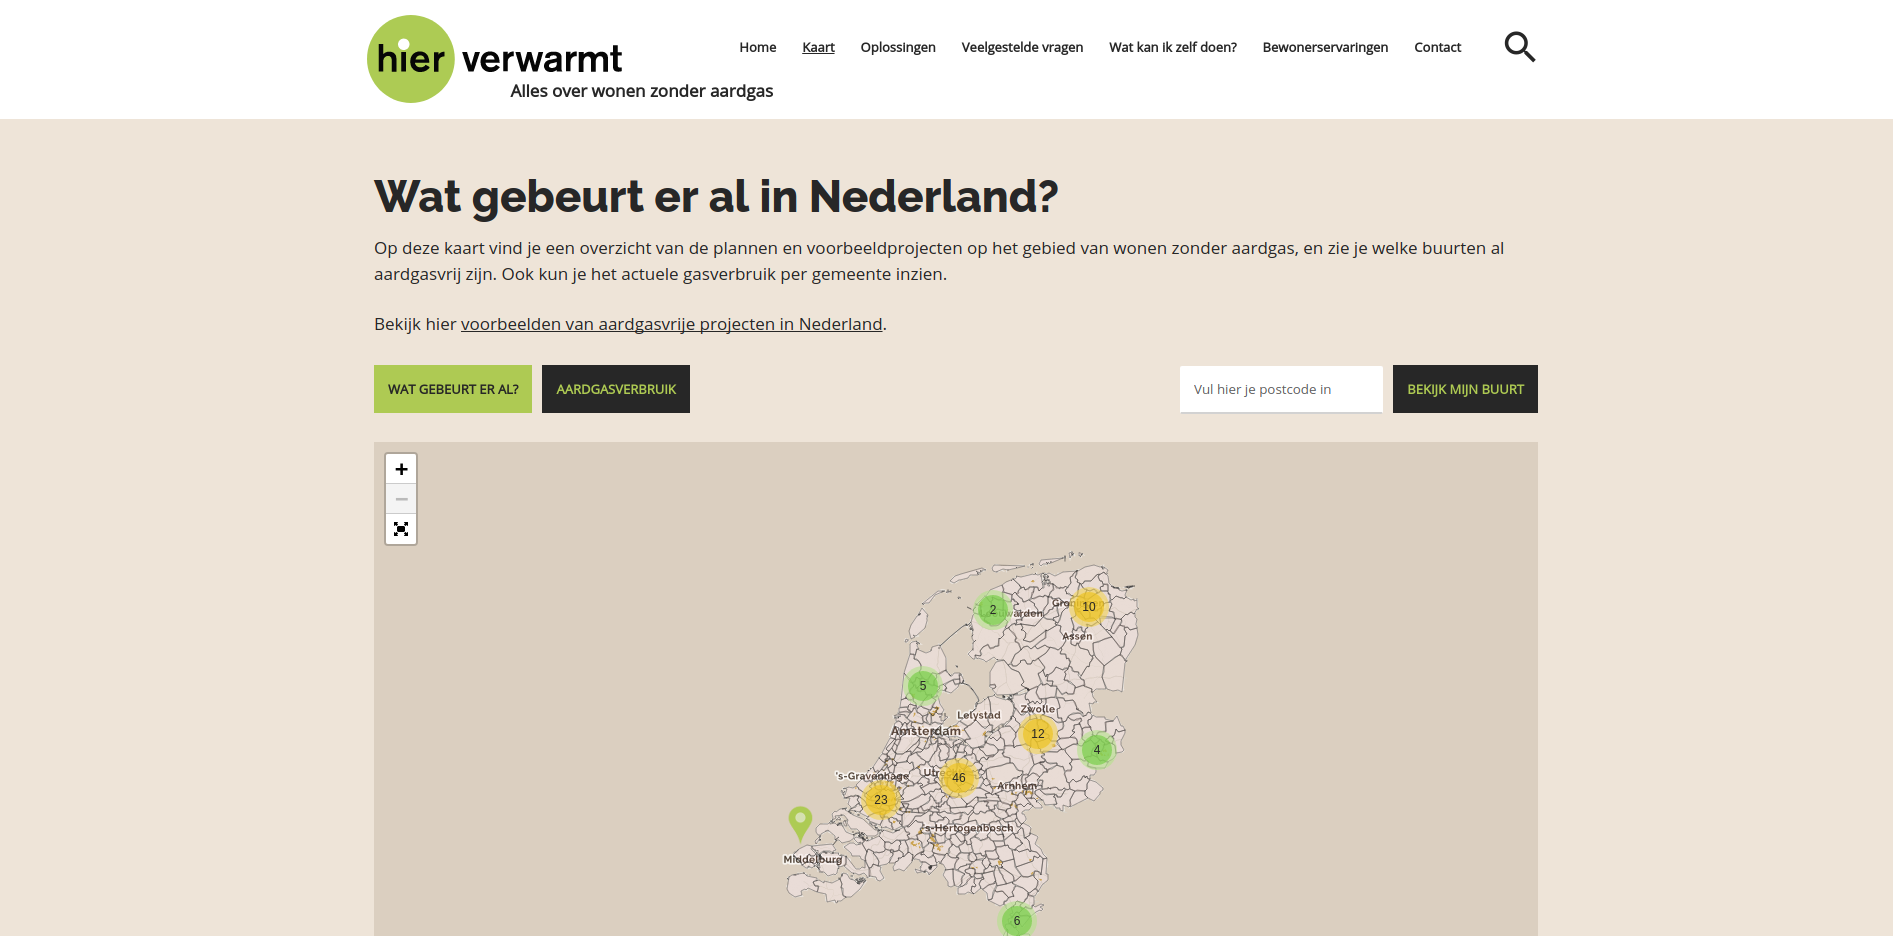
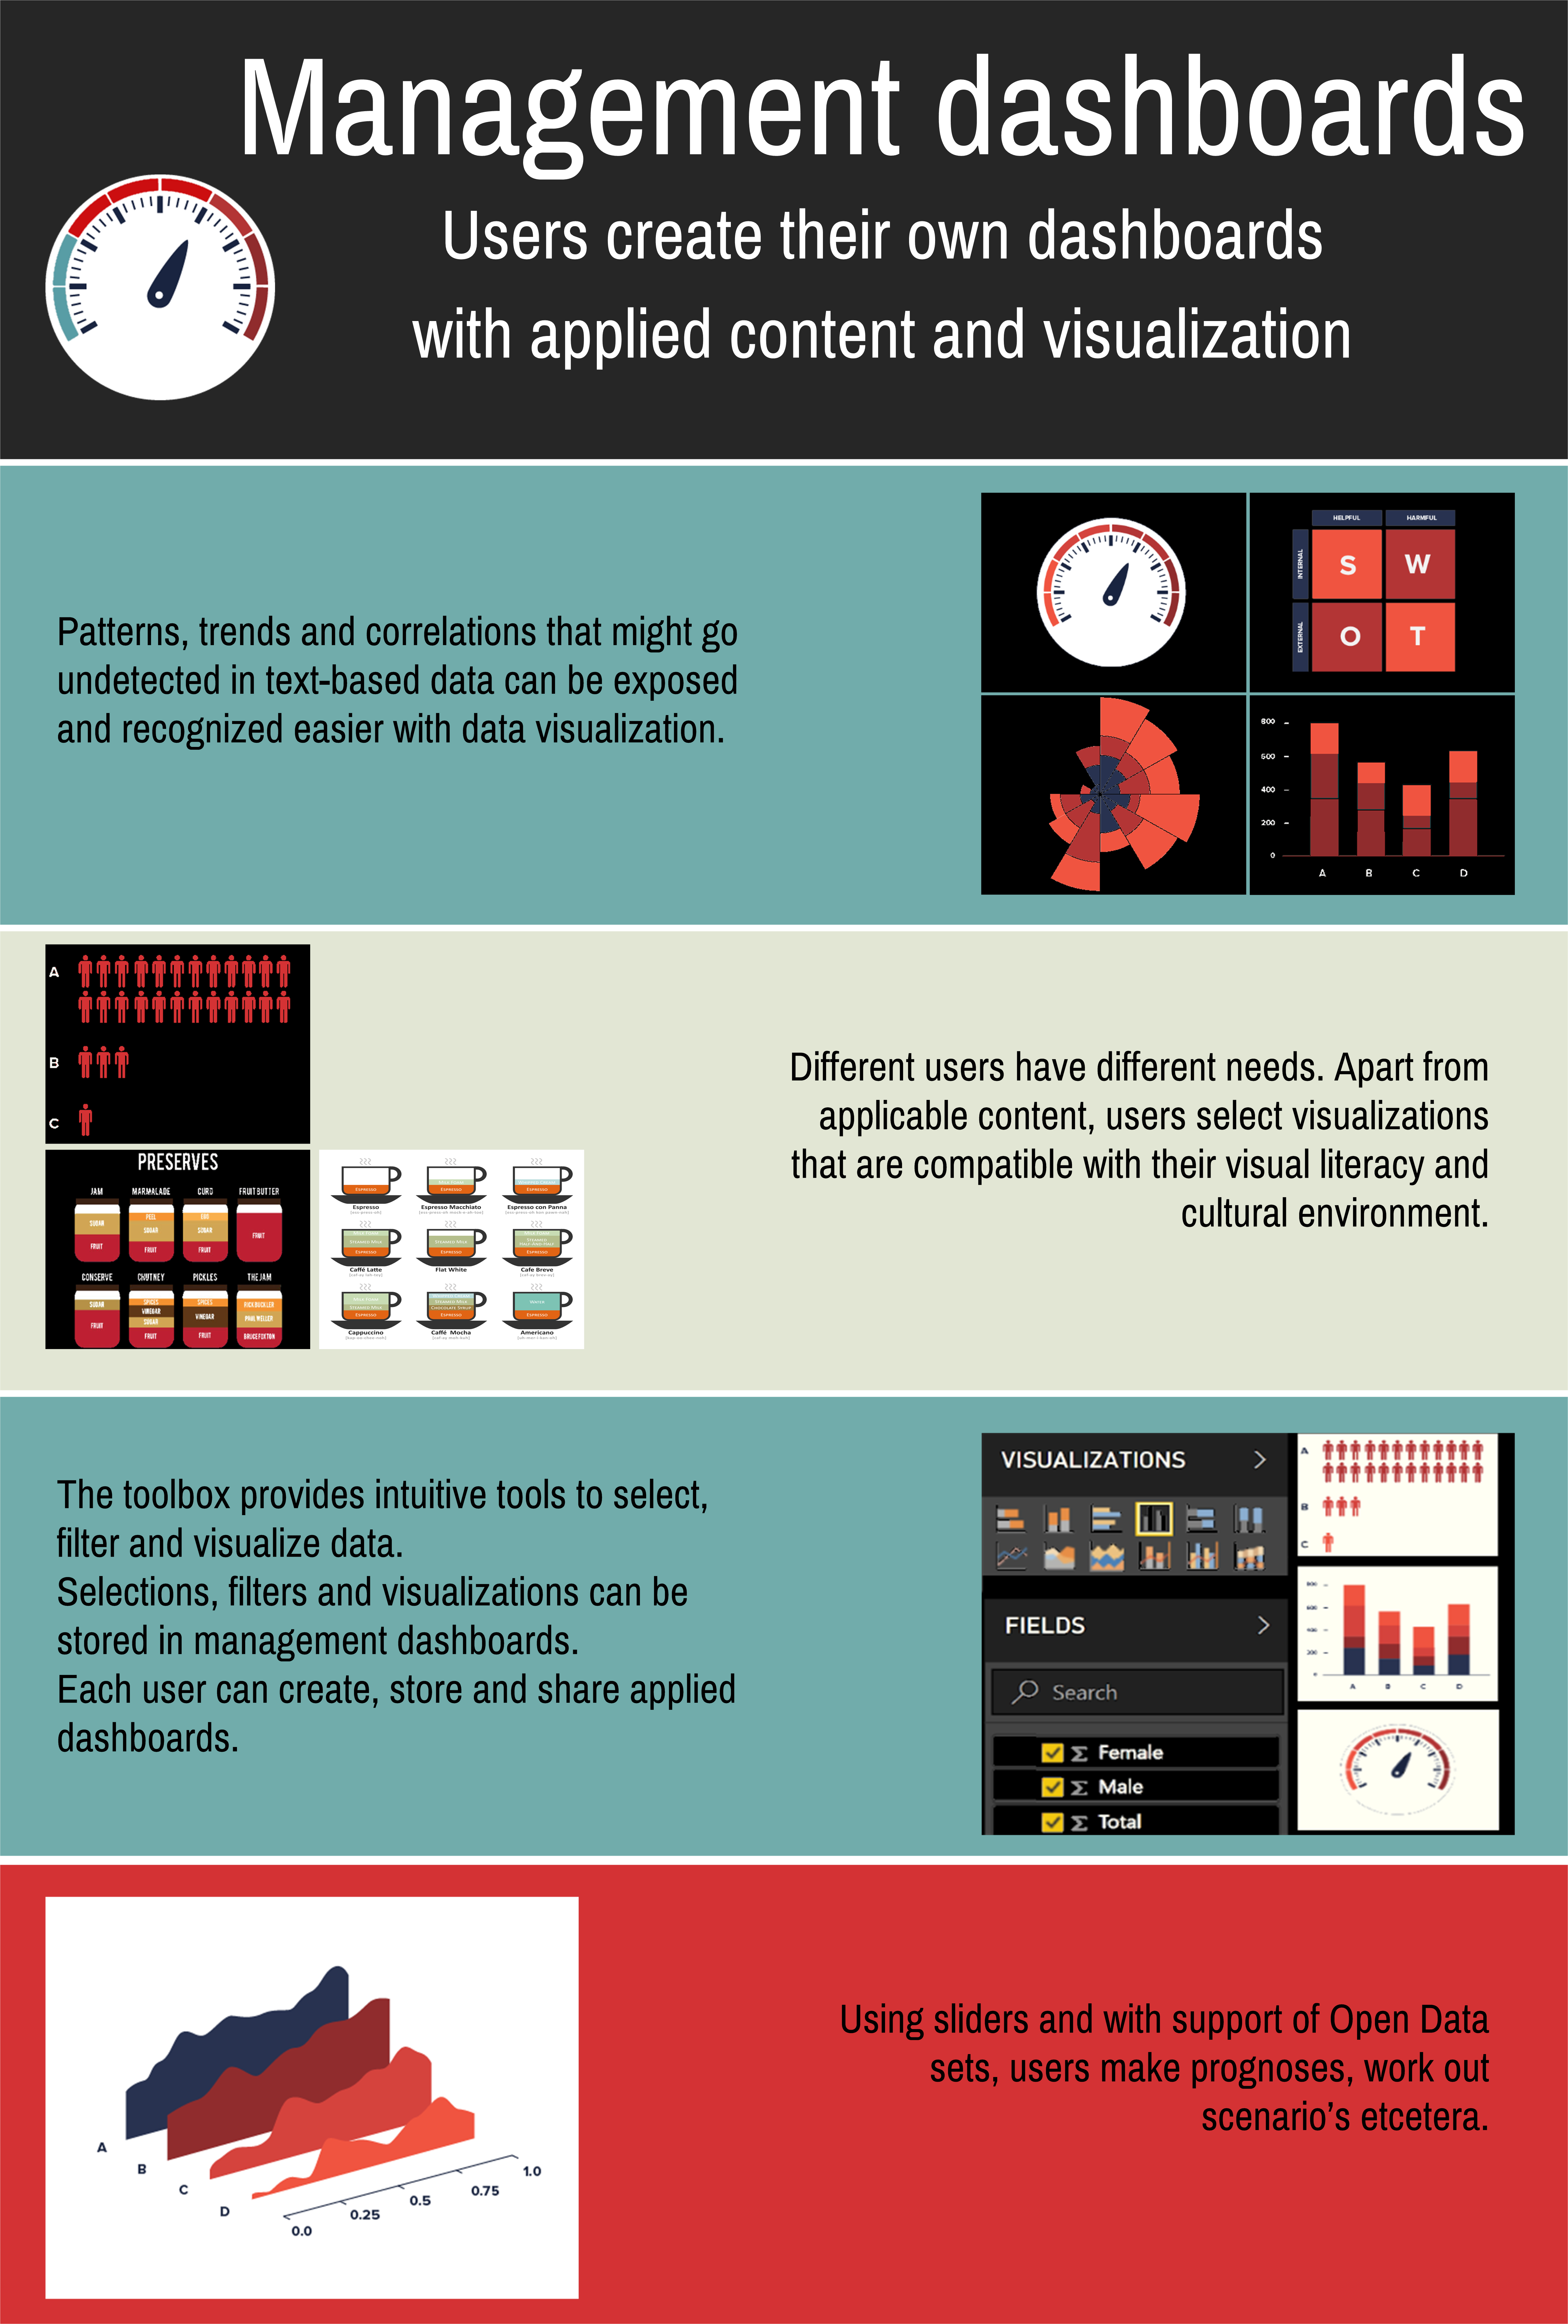
Patterns, trends and correlations that might go undetected in text-based data can be exposed and recognized easier with data visualization. The toolbox will provide various flexible tools to create selections, filters and visualisations of selected data. Views, diagrams and graphs can be stored in management dashboards. Each user can develop and manage his own dashboards.
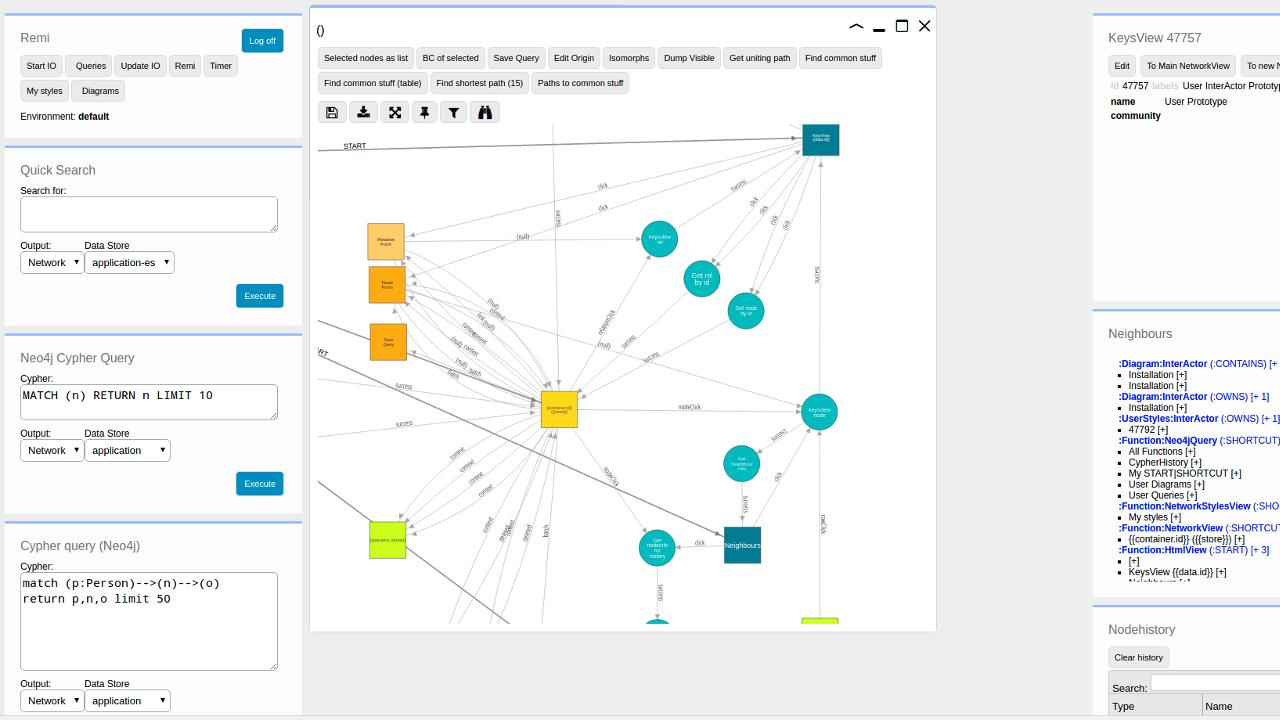
A great deal of knowledge can be represented as a network. Modern databases have evolved to store data in a network structure, in contrast to tables. In order to gain access to this graph-based knowledge, with InterActor you can query your database and visualise the results. It provides a visual programming environment, in which knowledge dashboards can be created without programming skills.