Datapoints
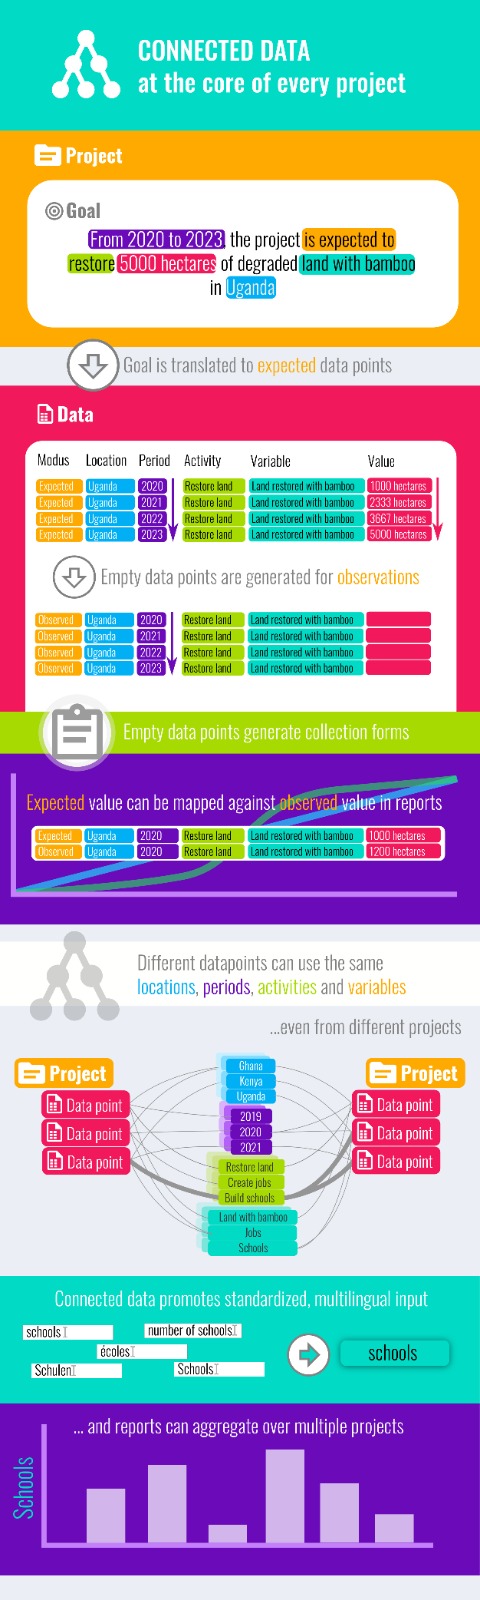
Data points are standardized components like a variable (‘the number of farmers”) , location (“ Kenya”), period (‘2019’), activity (trained), a value(‘1000’) and a modus (‘observed’). The data points will make it easy to generate field collection forms for different purposes, while the collected data feeds into project dashboards and project reporting. It will also facilitate customised reporting.
Using the data point system, project data can automatically be aggregated and aligned with outcome indicators at different levels, e.g. all activities in 2019 or all farmers trained in Africa).
Explanation
Step plan, converting goals to datapoints to completable field forms
Where consequent coding, code understanding (for instance, what is the difference between nominal and ordinal variables) and data alignment may be cumbersome for individual project teams, a centralised M&E setup will provide a great help. The working routine is as follows:
1. Upon project approval at head office, M&E staff:
- Creates a new project with relevant project budgeting and expenditure support, project planning, visualisation, project communication, repository and reporting facilities;
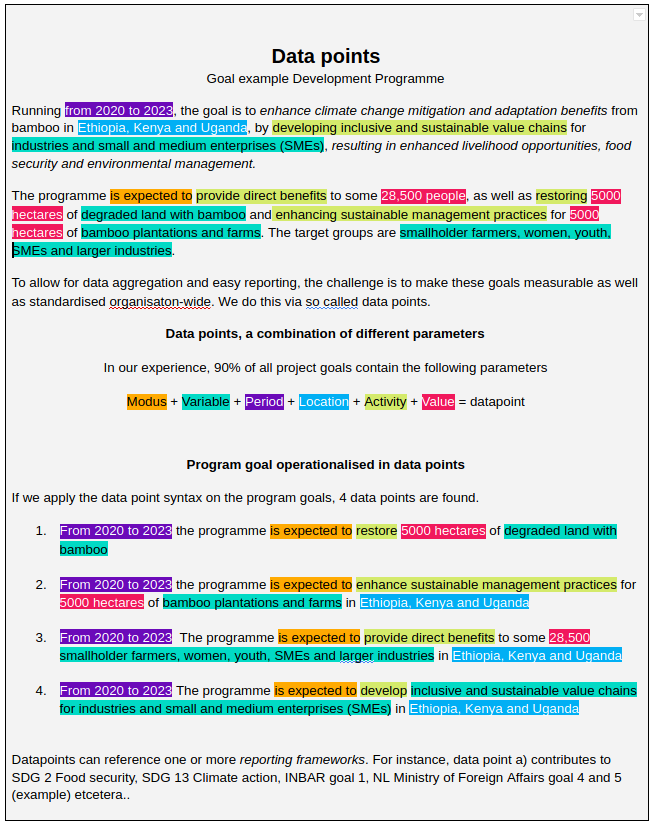
- Project goals are broken down into data points, using the project’s core vocabulary of parameters;
- Parameters not existing yet in the system.
2. Project space is handed to the project team.
- Project team starts planning, communicating, reporting and uploading documents within the project space;
- Data points for the defined variables are frequently collected in field and uploaded to the system;
3. Based on pre-configured dashboards, the impact of the individual project can be followed.
- Upon choice, dashboards may be shared life with third parties and/or;
- Dashboard elements are combined with narrative reports, downloaded and distributed internally and externally.
4. Pre-configured dashboards are available on country, regional and international level, showing combined aggregated impact of different projects.
Advantages
This setup carries advantages at many different levels.
Harmonized system
- Project teams do not have to bother with correctly connecting the parameters to units, connecting units to variables, connecting the lot to for instance IATI or other donor reporting;
- Parameters can be used and re-used by different projects in different languages;
- Measurement units, variables, code descriptors can be added at any time in the vocabularies without compromising the functionality;
- Entities (e.g locations, age groups, gender, education, profession etc) and variables (eg. number of, percentage, size, weight ) and units of measurement (if applicable: acres, metres, kgs, litres, currency etc) can be selected from vocabularies thereby avoiding spelling mistakes;
- Projects can use indicators in their preferred unit, with central staff having access to project results in another unit (acres instead of hectares, US$ instead of Euros) which makes comparisons and alignments possible;Parameters are standardised (text/integer/ordinal/nominal/unit), translatable, re-usable and combinable to new data points for different projects, regions.
- Parameters become available as forms to be completed by field staff. For instance, the value parameter may be presented as an integer with measurement unit ha or acreage. The measurement unit can be set project wide to ha, while field staff may use acres. The system will automatically recalculate acres to ha. Both parameters and field forms are fully translatable.
- When individual parameters for variables and activities are defined, additional standardised field collection questionnaires can be made.
- Because parameters become available as completable field forms, any data point will become available as a completable form. Completable forms become available via the earlier mentioned responsive offline page functionalities, with which field staff collects the metrics.
- If more projects use the same indicators, data collection and/or importation from own and/or external sources can be done for all related projects at the same time;
Easy reporting for different clients and reporting frameworks
- Central staff can aggregate project results on many different levels, making use of the supporting vocabularies;
- Intervals and ratios where necessary are automatically processed by the system.
- Project teams and central M&E staff uses underlying meta-data connections to report into different reporting frameworks in machine readable format;
- In case the report is written online within the M&E database, different preformatted text fields can be made available.
- Documents (for instance external reports) can be attached in any digital form. The Drupal system is highly flexible in allowing uploading audio visual files, inline playing of Youtube content, URL linking, iFrame, geotagging etcetera;
- Both online generated as well as uploaded project-data and supporting materials are consistently tagged and made searchable:
- All content is automatically indexed and searches options include faceted search, free text search (tags and text in files, labels, titles), spelling suggestions and synonyms where needed.
- Project and impact data can easily be found in the system through the tags, via the related project, country, geolocation, file name, reporting date, name of the reporter and other fields that the project may want to put to use.
- Indexed data may drive interactive queries. For instance, “show me a map with all schools in a selected region, schools with over 50% of girls attending”. Or “show a heatmap of schools with dropout percentages”.